|
|
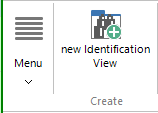
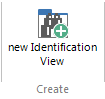
New
identification view
Create a new
Identification view as database tab for spectral database search.
Each database tab holds one database and consists of four subdivisions
(select as vertical tabs on the left side):
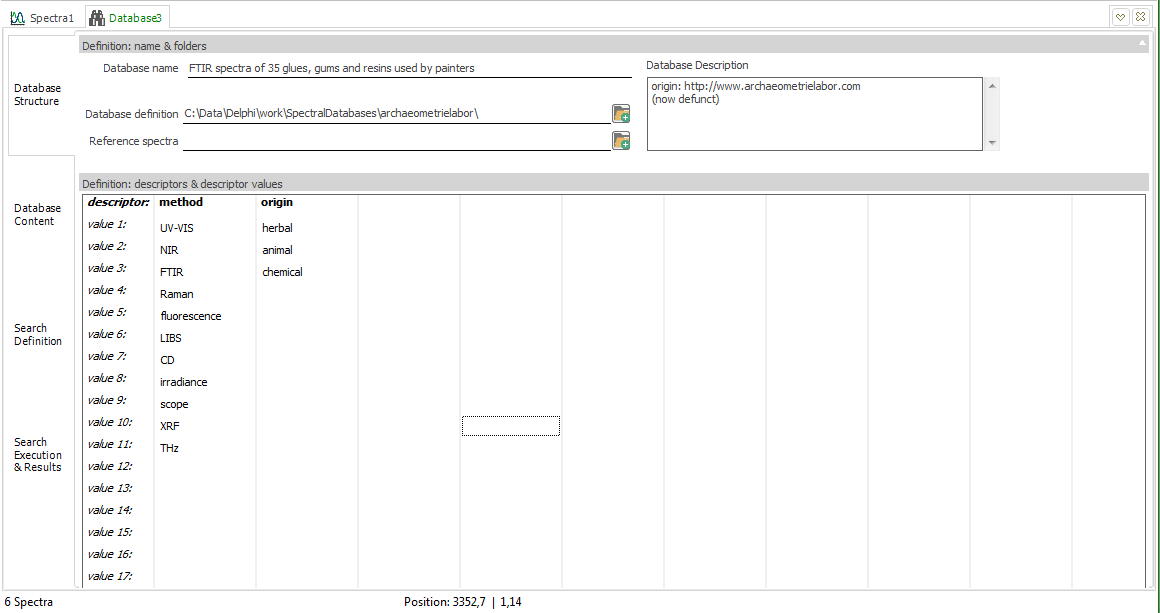
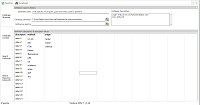
1) Database Structure: enter a database name and default
file pathes, give a description, define descriptor categories
and list descriptor values. "Method" is a mandatory
descriptor, containing measurement methods as values.
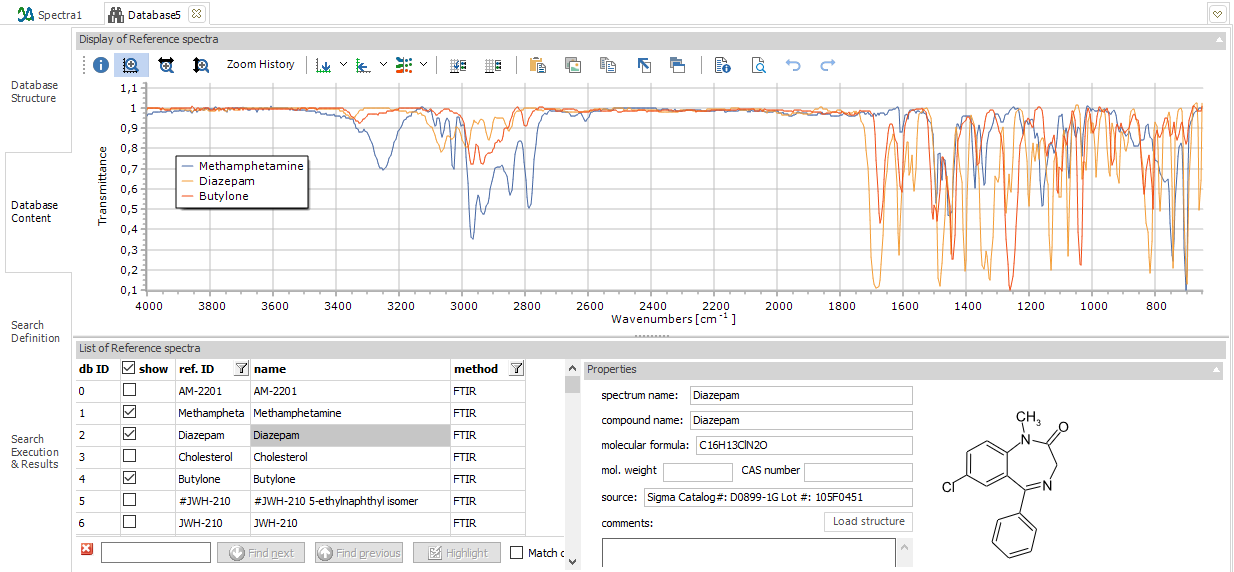
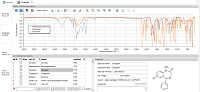
2) Database Content: listing of reference entries, set
reference ID, assign descriptor values, enter meta data, load
molecular structures, display reference spectra, search for reference
entries
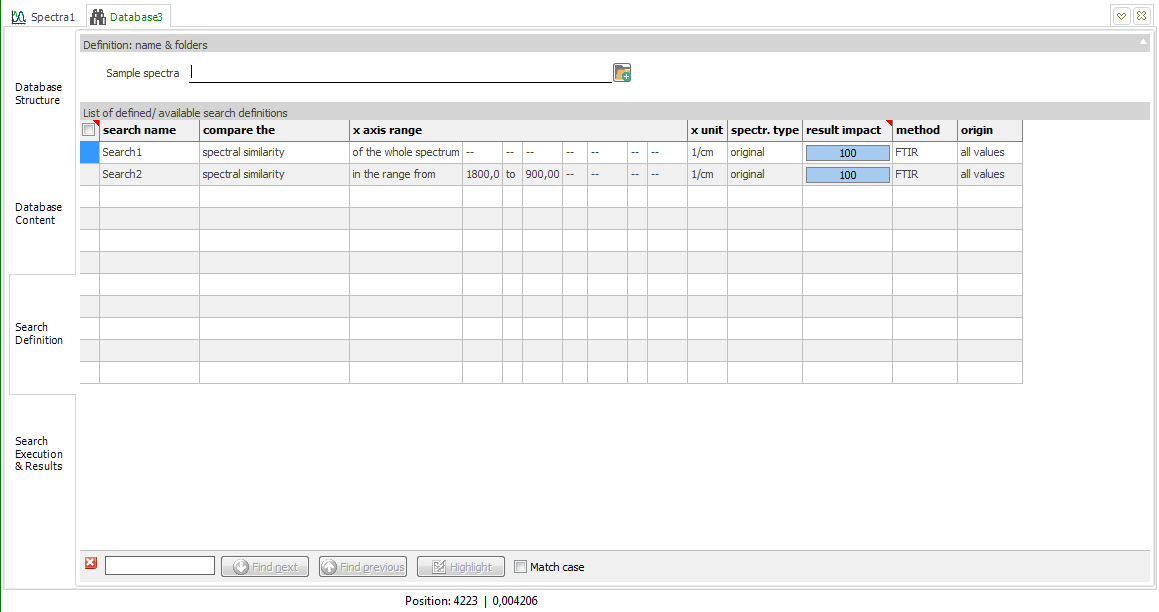
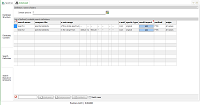
3) Search definition: create search definitions , restrict
searches to parts of the database, combine and weight search definitions
for combined result assessment
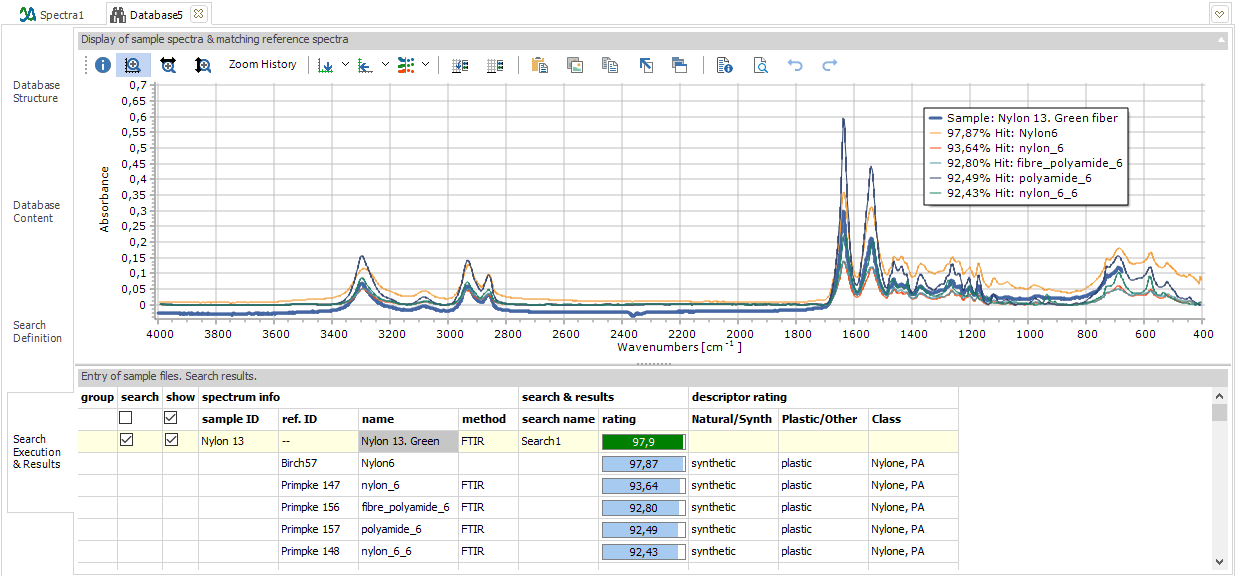
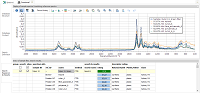
4) Search Execution & Results: load sample spectra,
select search definitions, review search results, display sample
spectra and best hits from database. Save and reload search results,
export results to Excel, create PDF search reports sample-wise.
|
 |
 |
 |
 |
| Database
Structure: default descriptor "method" + one
user-defined descriptor ("origin"). Name and description
entered by user. |
Database
Content: list of loaded reference spectra below, reference
ID edited, meta data and molecular structure on the right,
three reference spectra selected and shown in the plot above. |
Search
Definition: with two defined searches, differing in the
used x axis range. Combine searches by using the same search
name. |
Search
Results: after loading a sample spectrum, selecting a
search type and executing the database search, an ordered
reference hit list is shown and can be displayed in plot above.
|
|
| |
<jump
back to top> |
|
|
Database
creation & configuration
A Spectragryph
database consists of three files:
*.sgdd: contains the database definition (first vertical
tab)
*.sgdr: contains the database content, the reference entries
(second vertical tab)
*.sgds: contains the search definitions (third vertical
tab)
Additionally, *.sgsr: contains search results consisting
of sample spectra and a hit list (fourth vertical tab)
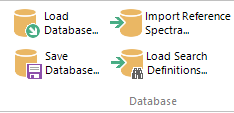
For creating a new database, start in the first
vertical tab (Database Structure). Enter a database name and
a database description into the edit box on the right side. Optionally,
a default filepath for the database files and for the reference
spectra's original files can be defined. To better describe and
categorize the database's reference entries, add your own descriptors
and define a range of allowed descriptor values. These
can be any kind of alphanumeric content. Additional rows can be
created by pressing CTRL+ArrowDown within a cell from the lowest
row. When finished with this tab, save the database with the Save
Database... button. Saved databases are loaded with the Load
Database... button.
|
 |
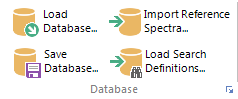
Next,
add reference spectra (all spectral file formats, OMNIC database
files *.lbt/ *.lbd and Thermo GRAMS/ Spectral ID database files
*.idx) with the Import Reference Spectra ... button. This
happens in the second
vertical tab (Database Content). For every loaded reference
spectrum, the "method" descriptor gets filled automatically,
the "name" column is equivalent to the legend text (can't
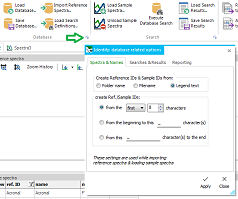
be edited), the unique db ID is assigned and, depending on
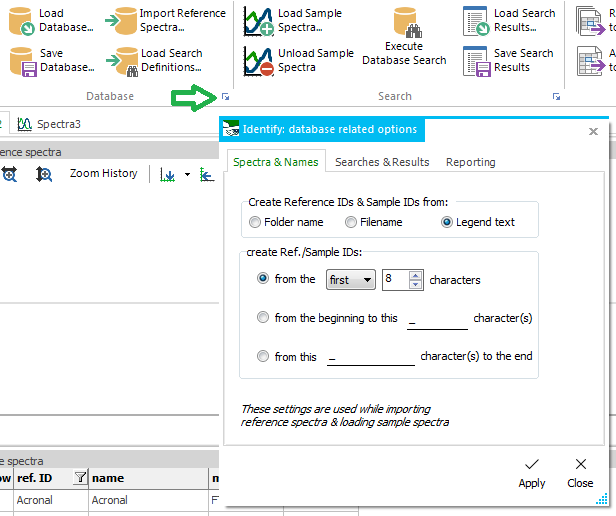
the choosen options a reference ID is assigned. The reference
ID can be edited and helps to assign and classify reference entries.
There is a multitude of options for creating the reference ID from
the legend text, filename or foldername. The same reference ID can
be used for multiple reference entries. This allows to group several
spectra of the same reference material, even from different measurement
techniques.
If there are user-defined descriptor categories, they are listed
in columns right to the "method" column. For each reference
spectrum, a descriptor value can be choosen from the cell's dropdown
list. When creating new descriptor categories of descriptor values
after loading reference spectra, these are only available here after
saving the database once more.
For showing reference spectra in the above plot window, select them
in the "show" column. Clicking the checkbox in the "show"
column's first row, results in showing/ hiding spectra of all reference
entries (not wise if there are thousands).
The columns for reference ID and descriptor values each can be filtered
for certain content, in order to show only a certain part of the
reference entries. The search bar at the bottom allows to search
for any text in the grid above.
After adding new reference entries, save the
database before executing a search! |
  |
Now,
use the third
vertical tab (Search Definition) to create search definitions.
Start with the "compare the" column and select an algorithm
from the dropdown list. When nothing special is desired, try first
the "spectral similarity" algorithm. It works with
all kind of spectra (UV-VIS absorbance and transmittance, NIR, FTIR,
Raman, ...) and is based on calculating a full-spectrum Pearson
correlation coefficent. Depending on the algorithm, some options
for restricting the x axis range are available. Select one from
the "x axis range" column and enter the numbers on the
right into the appropriate cells. All algorithms can be applied
to the original spectrum, as well as to a smoothed spectrum and
first and second derivatives. While executing searches, the same
transformation is temporarily applied to the reference spectra.
By choosing a dedicated descriptor value within the "method"
column and all user-defined descriptor columns to the right, the
search range can be restricted to matching reference entries.
Search definitions sharing the same name ("search name"
column) are executed together and give one common result and rating
value. To visualize such search groups, click the check box in the
first-row, leftmost cell (see left). For search groups, the result
impact of each search definition can be weighted by changing the
value in the "result impact" column.
Search rows can be removed by simply pressing DEL key. Additional
rows can be created by pressing CTRL+ArrowDown within a cell from
the lowest row. The Load Search Definitions allows to load
a saved search definition (file type *.sgds) and add the search
definition to the current list of search definitions.
After changing searches or defining new searches,
save the database before executing a search! |
| |
<jump
back to top> |
|
|
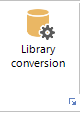
Library
Conversion
This function
can convert commercial libraries into native Spectragryph libraries,
including meta data and molecular structures. It will accept in
Nicolet OPUS (*.lbd/lbt) or GRAMS/ SpectralID (*.idx) file format.
After clicking the button, select the file(s) to be converted
and click Open. You will be shown a progress window with a status
for all selected libraries. Files will be saved into C:\Users\Public\Documents\Spectragryph-id\Libraries
or C:\Users\Public\Documents\Spectragryph-id-on\Libraries,
depending on the use level of your Spectragryph installation.
From there, they are available for multi-library
search from the Analyze ribbon, and for
live library search during acquisition from the Acquire ribbon.
|
| <jump
back to top> |
|

|
Database
Search Execution
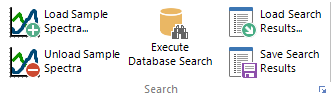
The real searching
happens in the fourth
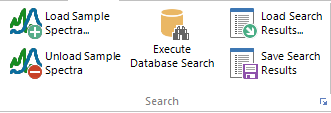
vertical tab (Search Execution & Results). For
any sample spectrum to search, load it first with the [Load Sample
Spectra...] button. It is selected by default for searching (checkbox
in "search" column) and the first search definition
from the list of search definitions is selected in the "search
name" column, also by default. Both can be changed as
needed. The sample ID can be edited. As with reference spectra,
a "sample" can also consist of several spectra
of one or multiple types, to cover cases where several spectra
describe one sample. As with the reference ID, the creation of
the sample ID can be directed by changing the options in the options
dialog.
Execute the search with the Execute Database Search button.
Searches are comparing the sample spectrum against all reference
spectra according to the selected search definition, restricted
by descriptor selection and spectral method (only reference spectra
with same method type are considered). As output, an ordered list
of search hits are shown, with the hit rating value and the descriptor
values of the found reference entries. Search results can be saved
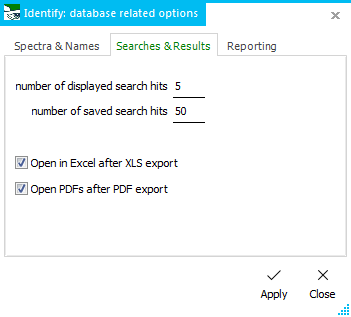
with the Save Search Results... button. The number of displayed
hits can be changed on the fly from the options dialog, as well
as the number of saved hits. With the Load Search Results
button , previously saved search results can be loaded again into
the same grid.
The sample spectrum together with the best reference hits can
be displayed in the plot above by clicking the checkbox in the
"show" column. The search bar at the bottom allows to
search for any text in the grid above.
|
| <jump
back to top> |
|
|
Search
Report generation
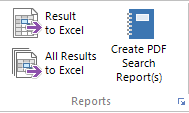
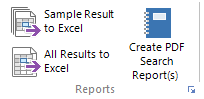
Here you can
transfer the search results to Excel, either as one Excel file
per sample (the upper left button) or else all results into a
big single file (the lower button). The created Excel files will
be instantly opened into Excel for review, if the option was set
in the options dialog.
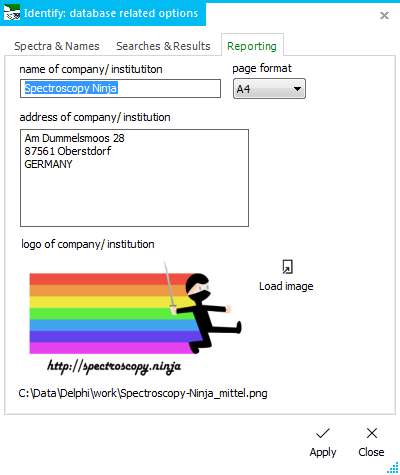
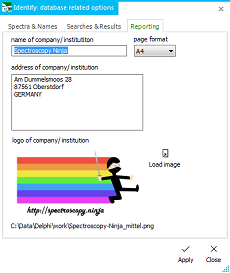
The Create PDF Search Report(s) button allows to create
a configurable and layouted PDF file that can serve as printable
report. In the options dialog (see left), company name, address
and logo can be entered. This will make up the header of the Search
report. It further contains information about the used database
(name & description), information about the searched sample
(sample ID and according spectrum names), and finally the search
results with best hit, hit table and a plot of sample spectrum
with best hits. One search report is created per sample ID, and
get's created for all present samples. Created reports get opened
in your systems PDF reader, if the option was set in the options
dialog.
In the options dialog, the report's page format can also be set.
Additionally, all described database search options available
in the options dialog can be permanently set ("Keep options
permanently") with the general options feature from the "File"
menu, so that they are already set after the next software start..
|
| <jump
back to top> |
|
![[SpectraGryph]](gryphon_white_green_96.png "back to SpectraGryph main page")