|

|
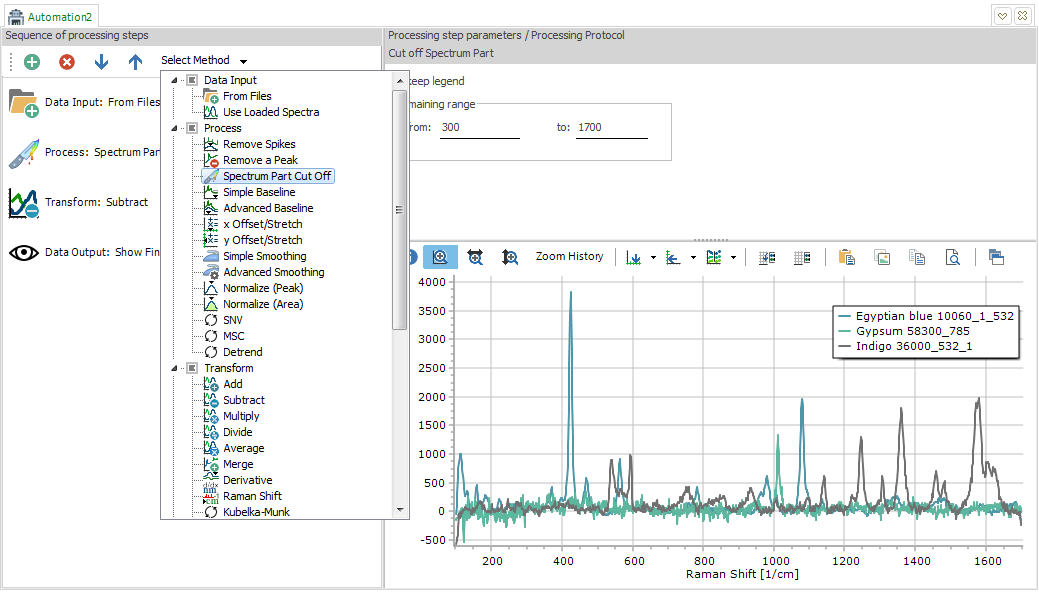
New Automation view
Create a new
Automation view as the tab for processing automation. On the left
side, create, remove and reorder processing steps. Select a processing
method for each step from the drop down menu. Set the respective
parameters on the right upper side.
Each sequence has to begin with a step from the "Data Input"
section, and to end with a step from the "Data Output"
section. These are the only rules. The software will remind you
if you forget and also nudge these two steps into the right position,
if necessary.

|
| |
<jump
back to top> |
|

|
Explanation
of Processing steps
Data Input
Each processing
sequence needs to know which data to process. You can either simply
process the loaded spectra in the spectrum plot, or else load the
data from files, with several options available.
 |
As file
selection mode, you can have "selected files",
which shows a File Open dialog for manually selecting files;
or else with "all files from folder" it will
work on all readable files in the defined folder. If no folder
information exists, it will again show a File Open dialog.
Check the "process in batches" option and
define the batch size, for running the processing in batches.
This can help if the files are very large or a large number
of files needs to be processed. |
Process
All the functions
from the Process ribbon
are available here as processing steps, plus changing of legend
texts. Each processing step will act on all spectra and remove
the original spectra.
Transform
All the functions
from the Transform ribbon
are available here as processing steps. Each
processing step will act on all spectra and remove the original
spectra.
Analyze
All the functions
from the Analyze ribbon
are available here as processing steps. As the first three functions
create analysis results as data output, there is an option for defining
the output directory for the resulting csv file, and also an option
to open the created csv file. The created csv file will also be
mentioned in the processing protocol.
Fluorescence
All the functions
from the Fluorescence/EEM ribbon
are available here as processing steps.
Data Output
As final step,
simply show the resulting spectra with "Show Final spectra",
or else save the data and/or the plots as individual or combined
files, with all the options known from the same functions in the
File menu. |
| |
<jump
back to top> |
|

|
Definition of Processing steps
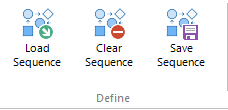
- With the "Load
Sequence" button, a previously saved processing sequence
file can be loaded again for execution.
- The "Clear Sequence" button empties the current list
of processing steps.
- Once a processing
sequence is finished, it can be saved as Spectragryph processing
sequence file (*.sgps) with the "Save Sequence" button.
|
| |
<jump
back to top> |
|

|
Execution of Processing steps
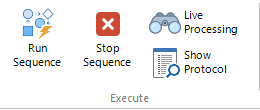
- The "Run
Sequence" button executes the current sequence of processing
steps. Each sequence has to begin with a step from the "Data
Input" section, and should end with a step from the "Data
Output" section. When "Use loaded spectra" was
defined as Data Input, load the spectra series to be processed
into the plot window first, then execute the sequence. In the
upper right window will be a processing protocoll, together with
a progress bar during processing.
- The "Stop Sequence" will interrupt a running execution
at the next possible point, however not remove the defined sequence.
- Only with "Live Processing" activated, the actual
transformations will be visualized in the plot window. Otherwise,
for sake of processing speed, only start and end results are visualized.
And this only if the appropiate processing steps are used ("Use
loaded spectra" for input and "Show final spectra"
for output)
- "Show Protocoll" will recall the processing protocol
of the last execution, if there was one.
|
| |
<jump
back to top> |
|
![back to SpectraGryph main page [SpectraGryph]](gryphon_white_green_96.png)
![back to SpectraGryph main page [SpectraGryph]](gryphon_white_green_96.png)