|
|
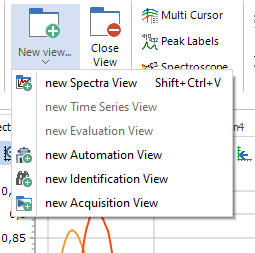
New
view...
Here you can
create a new view of different types. Each view is created in
an own separate tab, with a name and icon depending on its type.
Each view type has its own characteristic set of inline buttons
at the top (explained with their respective ribbons). The greyed
out types will be implemented in future versions.
Change the tab name after double-clicking on it. Change the tab
order by drag&dropping tabs. Tabs can be dragged out of the
main window as separate windows and docked into it again afterwards,
but not all functionality is available for such separated tabs.
Close view
Close the current
tab by clicking on the "Close View" button or the Close
symbol [ x ] inside each tab header. Tabs can also be closed
by the CTRL+W key shortcut.

|
| <jump
back to top> |
|
|
View enhancements
These are three
ways to enhance a spectra view. The multicursor gives a collective
vertical readout for all spectra at a movable x position. The additional
peak labeling toolbar has many options for automated and manual
labeling of peak maxima. The spectroscope view bar show the spectral
as if the measured sample was viewed through a visual spectroscope. |
| <jump
back to top> |
 |
Multi
cursor 
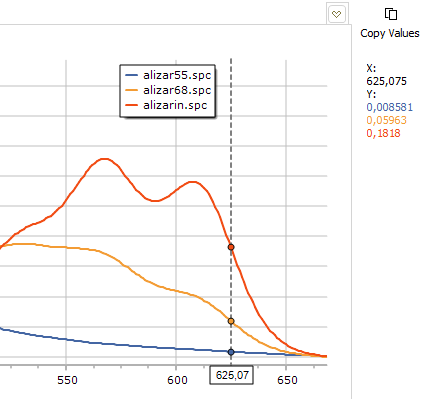
The multicursor
tool gives a collective vertical readout for all spectra at one
movable x position.
Use the left mouse button to grip and move the dashed vertical line.
The data values are shown and updated live in the rightmost area.
The values are in the same order as the spectra (as seen in the
legend box). The y values are shown in the same colours as the corresponding
spectra.
With the upper "Copy Values" button, the values are copied
to the clipboard for further use.
Another click onto the "Multicursor" button will remove
both the vertical line as well as the right-hand value display area.
|
| <jump
back to view enhancements> |
<jump
back to top> |
Peak
labels 
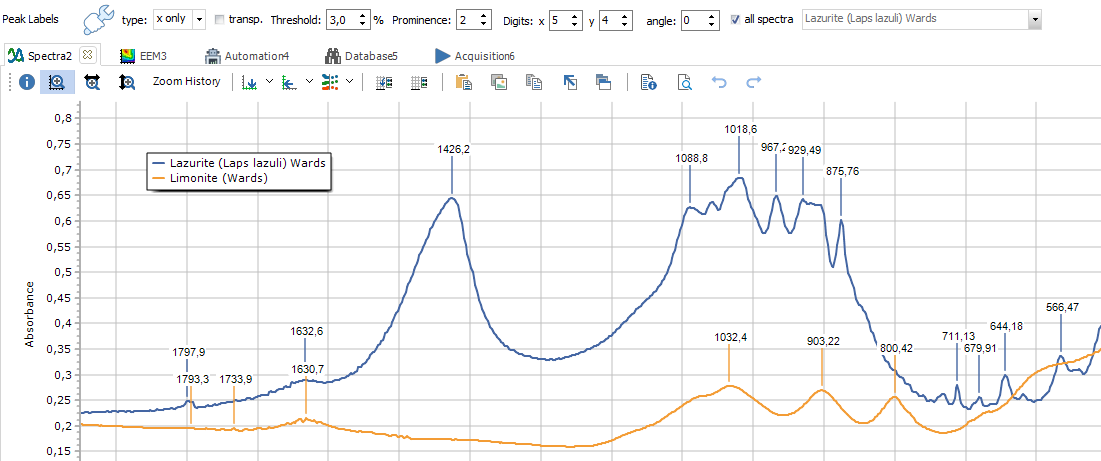
This function allows automated peak labeling of maxima
(and minima in transmission mode). Exact peak positions are calculated
by fitting a 3rd order polynom and solving the polynom equation.
The vertical label line starts at the nearest x value position.
Many labeling options are available:
- label type: a label can consist of both a peaks x and y value,
or only one of them. Several specific label types are available
for special types of spectra: "LIBS" for atomic emission
spectra, "XRF" for x-ray fluorescence and "Gamma"
for radiation from radioactive nuclides. For each of those, elements
can be chosen from a PSE table and a position tolerance can be
set. See also a tutorial
video.
- threshold: to rule out labeling of noise-related maxima from
the lower part of the spectrum, a lower limit for detecting peaks
is set (default: 5% of Max-Min).
- prominence: a principle borrowed from geography. A prominence
of 10 will show only the most prominent peak of all, lower prominence
values show more of the little peaks. Minimum is 1.
- digits (x, y): define the number of relevant digits for the
displayed values.
- angle: use 90° for showing vertical labels, 0° for horizontal
ones, and any values inbetween for inclined labels.
- spectra selection: either select a single spectrum in the drop
down menu or label all spectra together.
In addition,
by clicking on the  symbol, it is possible to manually edit, remove and add labels.
This manual edits are shown when the manual mode is active, and
hidden when it is inactive. Manual edits are saved and reloaded
when using the native Spectragryph *.sgd files.
symbol, it is possible to manually edit, remove and add labels.
This manual edits are shown when the manual mode is active, and
hidden when it is inactive. Manual edits are saved and reloaded
when using the native Spectragryph *.sgd files.
Several options are available: 
- remove all peak labels
- remove individual peak labels
- restore labels based on parameters from automated labelling
- move label text position
- reset label text positions
- add a custom label
- edit label text
|
| <jump
back to view enhancements> |
<jump
back to top> |
Spectroscope
view 
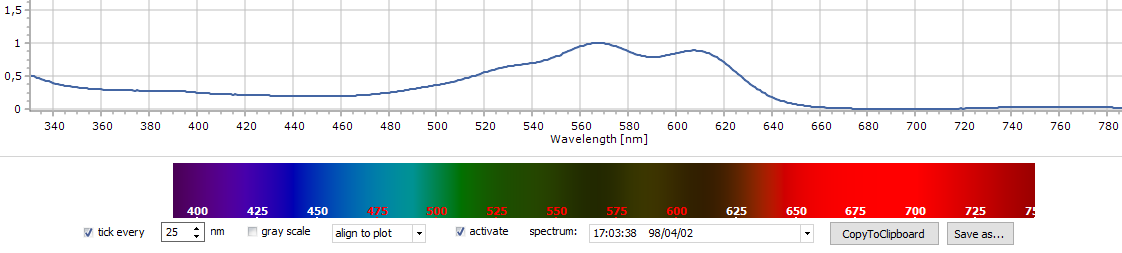
To simulate the view through a visual hand-held spectroscope, based
on current spectral data. Works for absorbance, transmittance and
emission data. The "rainbow view" color bar is located
below the spectra plot, and will move and stretch according to the
plot above. Select the spectrum of interest from the right drop
down box, check "activate" and the "rainbow"
view gets modulated by the spectral data values. Some options available:
- change the tick distance in 5 nm steps, or turn them off completely
- have the "rainbow view" converted to gray scale, consisting
only of brightness values
- have the "rainbow view" aligned and moving with the
selected spectrum, or keep it steady
- Copy it to the clipboard for copy&pasting the picture to anywhere
else, or
- save it as BMP file |
| <jump
back to view enhancements> |
<jump
back to top> |
|
|
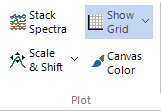
Tweaking
plot display
- With the "Stack
spectra" function, you can vertically stack up to 15 spectra
at once. Each one then has it's own y axis. Zooming, panning and
scrolling happens simultaneously for all of them, but please use
the topmost spectrum for this.
- With "Scale & Shift" activated, you can shift
around individual spectra (left mouse button), and also stretch/
compress them (Shift key + left mouse), without effect on the
original data. Several options are available from the dropdown
menu:
- use
only x offsets (for horizontal shifting/ stretching)
- use only y offsets (for vertical shifting/ stretching)
- allow x and y offsets (for
shifting/ stretching in both directions)
- spread all spectra evenly (for a waterfall kind of spectra display)
- reset changes (go back to initial display)
- make plot changes permanent (by changing the actual spectral
data)
|
- The "Show Grid" button allows to show/hide the grid
lines, which are located behind the spectra traces. From the dropdown
menu, select either solid or dotted grid lines
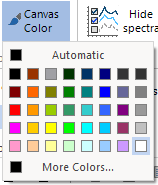 |
The
Color button lets you select any color as plot background.
It is only visible on screen, but not within printouts or
exported plot images. |
|
| <jump
back to top> |
|
|
Spectra
display options
This area has some
options for influencing the display of spectral traces. You can
temporarily hide from display a selection of spectra without removing
them. Line width is variable, data values can be shown as points,
color sequence for consecutive spectra is changeable and after playing
around, a default display can be set again. |
| <jump
back to top> |
Flip
through

For large numbers of loaded spectra (some dozens, hundreds or even
more), it is often helpful to not show them all at at once, but
to flip through like you do with a comic book, showing only a few
spectra at once. This feature is also activated on loading a large
number of spectra, the threshold can be set from File > Options
> Plot, Views, Spectra > Flip through.
- Select the number of concurrently shown spectra at the left (default
value defined form the same place in File > Options as above).
- flip back and forth with the blue arrow buttons
- quickly navigate through all spectra with the green slider
- grabbing the start or end number below the green slider allows
to change the interval size
|
| <jump
back to spectra display> |
<jump
back to top> |
|
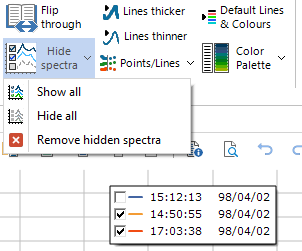
Hiding
spectra
On clicking the
spectra
hiding button, a checkbox is shown next to each legend entry in
the legend box . Uncheck a legend entry for hiding the corresponding
spectrum. Check it for showing again. After clicking the "Hide
spectra" button a second time, the legend box is shown normal,
but without the unchecked spectra and legend entries.
The button's dropdown menu has several options:
- "Show all" checks all legend entries at once, leading
to the full plot again. To be used before hiding only a few spectra.
- "Hide all" unchecks all legend entries at once, leading
to an empty plot. To be used before showing only a few spectra.
- After a decision to not only hide but actually remove the hidden
spectra, just click the "Remove hidden spectra" menu point.
|
| <jump
back to spectra display> |
<jump
back to top> |
Line
thickness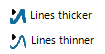
For changing the
global line width of all spectra together. Clicking one of the buttons
once changes the line width by one step. There are 9 steps available,
per default the second or third step is active.
When changing a single spectrum's line width in the "Spectra"
ribbon, this happens relative to the global line width from here.
Before printing and creating image files, a line width around three
is recommended. |
| <jump
back to spectra display> |
<jump
back to top> |
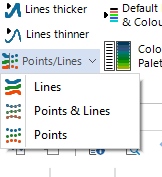 |
Points
& Lines
Normally, spectra
are represented as lines ("Lines" option). This dropdown
button allows to add small symbols at the position of the spectrum's
data points ("Points & Lines" option). Or, you can
show only the data points without the connecting line ("Points"
option). Not to confuse with the "line type" option from
the "Spectra" ribbon...
Sometimes, the data point marks might be hard to see, depending
on line width, x axis step width and zoom status. |
| <jump
back to spectra display> |
<jump
back to top> |
Standard
lines & colours 
Whichever weird
combinations of line color, line type, points&lines and global/
individual line width you chose, this button will set it back to
standard values. That is: colors from the standard color palette,
solid lines, no points, line width of two. However, all those weird
combinations can be preserved for eternity by saving as Spectragryph
*.sgd binary file. At least, this works for line type, width and
color. |
| <jump
back to spectra display> |
<jump
back to top> |
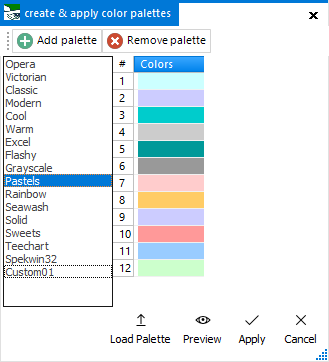 |
Color
palettes
Here you can choose
from 16 different color palettes to give distinguished colors to
your spectra plot. Each palette was optimized for viewing and printing
(no white, yellow, light grey color entries). Use the "Preview"
button for getting a glimpse on how your spectra will look like
with another palette. Press the "Apply" button to activate
the selected palette. The selected palette is also used as standard
palette with the "Standard Lines & Colors" function.
Create a fully user-defined, customized palette with the "Add
palette" button. By clicking on the color fields, you can then
add individual colors and edit the palette name. It is possible
to save and load custom palette files, for exchange with other users...
Finally, custom palettes can be removed again with the "Remove
palette" button (not possible for the 16 built-in palettes). |
| <jump
back to spectra display> |
<jump
back to top> |
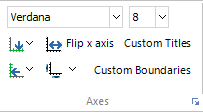 |
Axes
settings
- Use the upper
dropdown menus to set font type and font size for the axis titles
and axis tick marks. Use the lower right down arrow for full font
control.
- Switch the x axis direction with "Flip axis".
- Hide one or both axis titles from display with the "Show
Titles" button.
- Activate the display of your custom titles (to be defined by
clicking onto the axis titles) with the "Custom Titles"
button.
- Activate the use of custom axis boundaries (to be defined by
clicking onto the axes) with the "Custom Boundaries"
button.
|
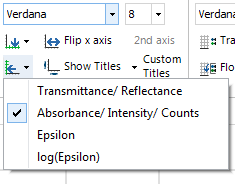 |
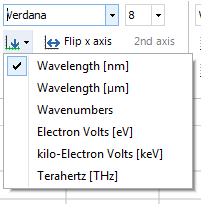
-
Select your desired x and y axis type for display from these two
buttons ("Change x axis" and "Change y axis").
Any spectrum can be displayed with every axis type, as long it makes
sense physically and is possible mathematically.
- IMPORTANT HINT: The calculations are done on the fly and do not
affect the spectral data as such, only the visual display is changed!
- ANOTHER IMPORTANT HINT: Axis types for spectra are assigned on
loading spectrum files, based on the information inside the file
(if nothing found, default types apply). These cannot be changed
afterwards. Renaming axis titles is not the same as changing axis
types! OK, there is one possibility: have a look at the "Interpolate,
Resample" function from the Transform
ribbon... |
| |
<jump
back to top> |
|
Legend
settings
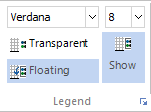
- Use the upper
dropdown menus to set font type and font size for the legend entries.
Use the lower right down arrow for full font control.
- Hide/ show the legend box surrounding with the "Transparent"
button
- Hide/ show the legend box as such with the "Show" button
- The "Floating" button switches the legend display between
fixed + outside the plot and floating + inside the plot. |
| |
<jump
back to top> |
 |
App
Style
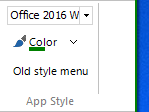
-With the upper
dropdown menu, choose from a wide range of historic app styles.
Office 2013/ 2016 are most recommended.
- The effect of choosing color for the app style is not available
for Office2010 and Win7. It is strongest for "Office 2016 White".
- With "Old style menu", a nearly classical pure menu
is shown, you can get back by clicking onto "Switch back modern
style" |
| |
<jump
back to top> |
|
![[SpectraGryph]](gryphon_white_green_96.png "back to SpectraGryph main page")